10 Essential Tips for Mastering Go Profiling with pprof
Profiling is a critical skill for any Go developer aiming to optimize performance. While the standard library offers pprof—a powerful, built-in profiler—many developers shy away from it due to its complexity. This guide breaks down the key profiling types, how to run them, and what to do with the results, all in a straightforward, actionable format. Whether you're a seasoned Gopher or just starting, these ten items will help you turn profiling from a dreaded rescue mission into a routine optimization tool.
1. Understanding Go's Built-in Profiling with pprof
pprof samples your program's call stack at regular intervals or on specific runtime events, generating detailed profile files. You can analyze these files using the go tool pprof CLI or its web interface to visualize CPU bottlenecks, memory leaks, or concurrency issues. No external plugins are needed—everything is included in the Go development kit. The main challenge is interpreting the low-level data, but once you master the basics, profiling becomes an invaluable part of your development workflow.
2. CPU Profiling: Finding Where Time Goes
CPU profiling captures call stacks at a fixed sampling rate (default 100 Hz) and shows you which functions consume the most CPU time. This helps identify hot code paths that slow down your application. To run a CPU profile, use pprof.StartCPUProfile() or the -cpuprofile flag with go test. After collecting data, generate a report with go tool pprof -top cpu.prof to see the top functions. Focus on functions with high cumulative time and look for opportunities to reduce unnecessary computations or optimize algorithms.
3. Heap Profiling: Tracking Memory Allocations
The heap profile shows currently allocated memory, helping you detect memory leaks and high usage. pprof samples allocations on each memory allocation (about 1 per 512 KB by default). Use pprof.WriteHeapProfile() or the -memprofile flag. Analyze with go tool pprof -alloc_space heap.prof to see where memory is still in use. Look for objects that accumulate without being freed, which often indicate missing garbage collection cycles or unintended references.
4. Allocs Profile: Understanding Allocation Patterns
Unlike the heap profile, the allocs profile records every allocation that occurred during the profiling period, regardless of whether the memory is still in use. This is crucial for identifying high-allocation functions that put pressure on the garbage collector. Use pprof.Lookup("allocs") to capture this profile. In pprof's web interface, switching between "alloc_space" and "inuse_space" views helps separate current memory usage from overall allocation activity. Reducing allocations often leads to significant performance gains.
5. Mutex Profile: Detecting Lock Contention
Mutex profiling reveals goroutines that are blocked waiting for a mutex lock, causing contention and reducing parallelism. Enable it by setting runtime.SetMutexProfileFraction(1). pprof records the stack trace of the goroutine that holds the lock and the one waiting. Analyze with go tool pprof -top mutex.prof. High contention often signals that a critical section is too large or that a synchronization primitive like a mutex could be replaced with a channel or atomic operation.
6. Block Profile: Tracking Blocking Events
The block profile captures when a goroutine is blocked on a channel operation, select statement, or synchronization primitive. Enable it with runtime.SetBlockProfileRate(1). This helps identify bottlenecks that cause your program to stall. Use pprof.Lookup("block") to generate the profile. Look for functions that block for long durations, and consider redesigning them with non-blocking operations or better concurrency patterns.

7. Goroutine Profile: Visualizing Concurrency
This profile shows the current number of goroutines and their stack traces. It's invaluable for identifying goroutine leaks (broken goroutines that never finish). Run pprof.Lookup("goroutine") to capture. pprof's flame graph or source‑level annotations help you see where goroutines are created and whether they properly exit. If you see thousands of goroutines stuck in the same place, you likely have a leak that needs fixing.
8. Step‑by‑Step: Running and Collecting Profiles
To collect a profile in your Go program, import net/http/pprof and add import _ "net/http/pprof". This registers HTTP endpoints like /debug/pprof/profile for CPU, /debug/pprof/heap for heap, etc. Then start an HTTP server. Alternatively, use the testing package with go test -cpuprofile flags. For long‑running services, use the pprof package's StartCPUProfile and StopCPUProfile functions directly. Always profile under realistic load to get meaningful data.
9. Interpreting Results: From Raw Data to Actionable Insights
After collecting a profile, run go tool pprof -http=:8080 profile.prof to open an interactive web interface. Use flame graphs to see the call stack visually, or the top view to list functions by time/allocation. Look for functions with high self or cumulative values. Focus on the biggest hitters first, and consider using benchmarks to verify improvements. Common actions: inlining, reducing allocations, optimizing loops, or introducing caching. Back to top
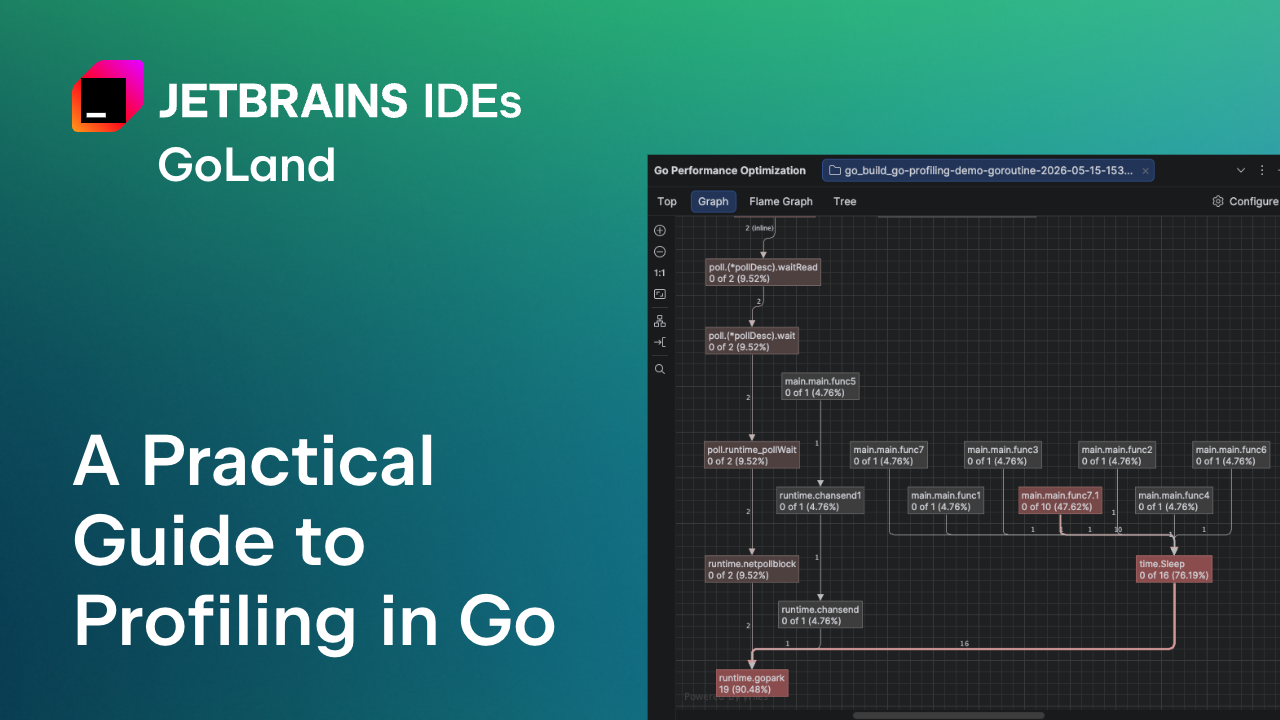
10. Making Profiling Easy with GoLand
JetBrains GoLand simplifies profiling with a single button. Go to View → Tool Windows → Profiler, then click the CPU or Memory profiler button. Run your application, and GoLand automatically collects and opens the profile in a visual editor. You can switch between flame graphs, call trees, and top lists without needing the pprof CLI. This integration removes the hassle of manual commands, making profiling accessible even for beginners. Continuous profiling tools like Pyroscope can also be integrated for real‑time monitoring.
Profiling doesn't have to be a last‑resort tool. With these ten tips, you can confidently identify and fix performance issues in your Go applications. Start by experimenting with CPU and heap profiles, then gradually explore mutex, block, and goroutine profiles as concurrency needs arise. Over time, profiling will become a natural part of your development cycle, leading to faster, more efficient software.
Related Articles
- Grafana Unveils Terminal-First CLI for Observability: gcx Targets Agentic Coding Blind Spots
- Startup DevOps Failures Cost Thousands in Recovery, New Analysis Reveals Top 10 Avoidable Mistakes
- Mastering AI-Assisted Development with Qt Creator 20 Beta: A Step-by-Step Guide
- AI Coding Tools Overwhelm Code Reviews: Fix Errors Before PR Submission, Experts Urge
- Decoding the FISA 702 Reauthorization Stalemate: A Step-by-Step Guide to the Reform Process
- Exploring Aerion: A Modern Desktop Email Client Worth Your Time
- Mastering Observability in Apache Camel: A Practical Approach
- Kubernetes Gateway API v1.5 Goes Live with Major Stability Upgrades and Scalable ListenerSet Feature